

A system map is a concise representation that shows in one picture all the various actors involved in a service/system, and all the relationships that bind them together (e.g., flows of materials, energy, information, economic resources, documents). The map highlights the service/system components and roles, linked together, emphasizing the value of their interaction.
Download The manual for the use of the instrument with suggestions e instructions.
For an in-depth theoretical study click here.
Your opinion is important to us. Please rate the tool based on your experiences or for how you would like to use it.


Take advantage of the new free service "Remote Lab". Request an appointment by filling out the form.
Tips
Indications from the DRLab experience for using the tool.
Instructions for compilation
Foreword. An effective system map is based on research data. Before proceeding to compile the map, make this data easily available to the working group.
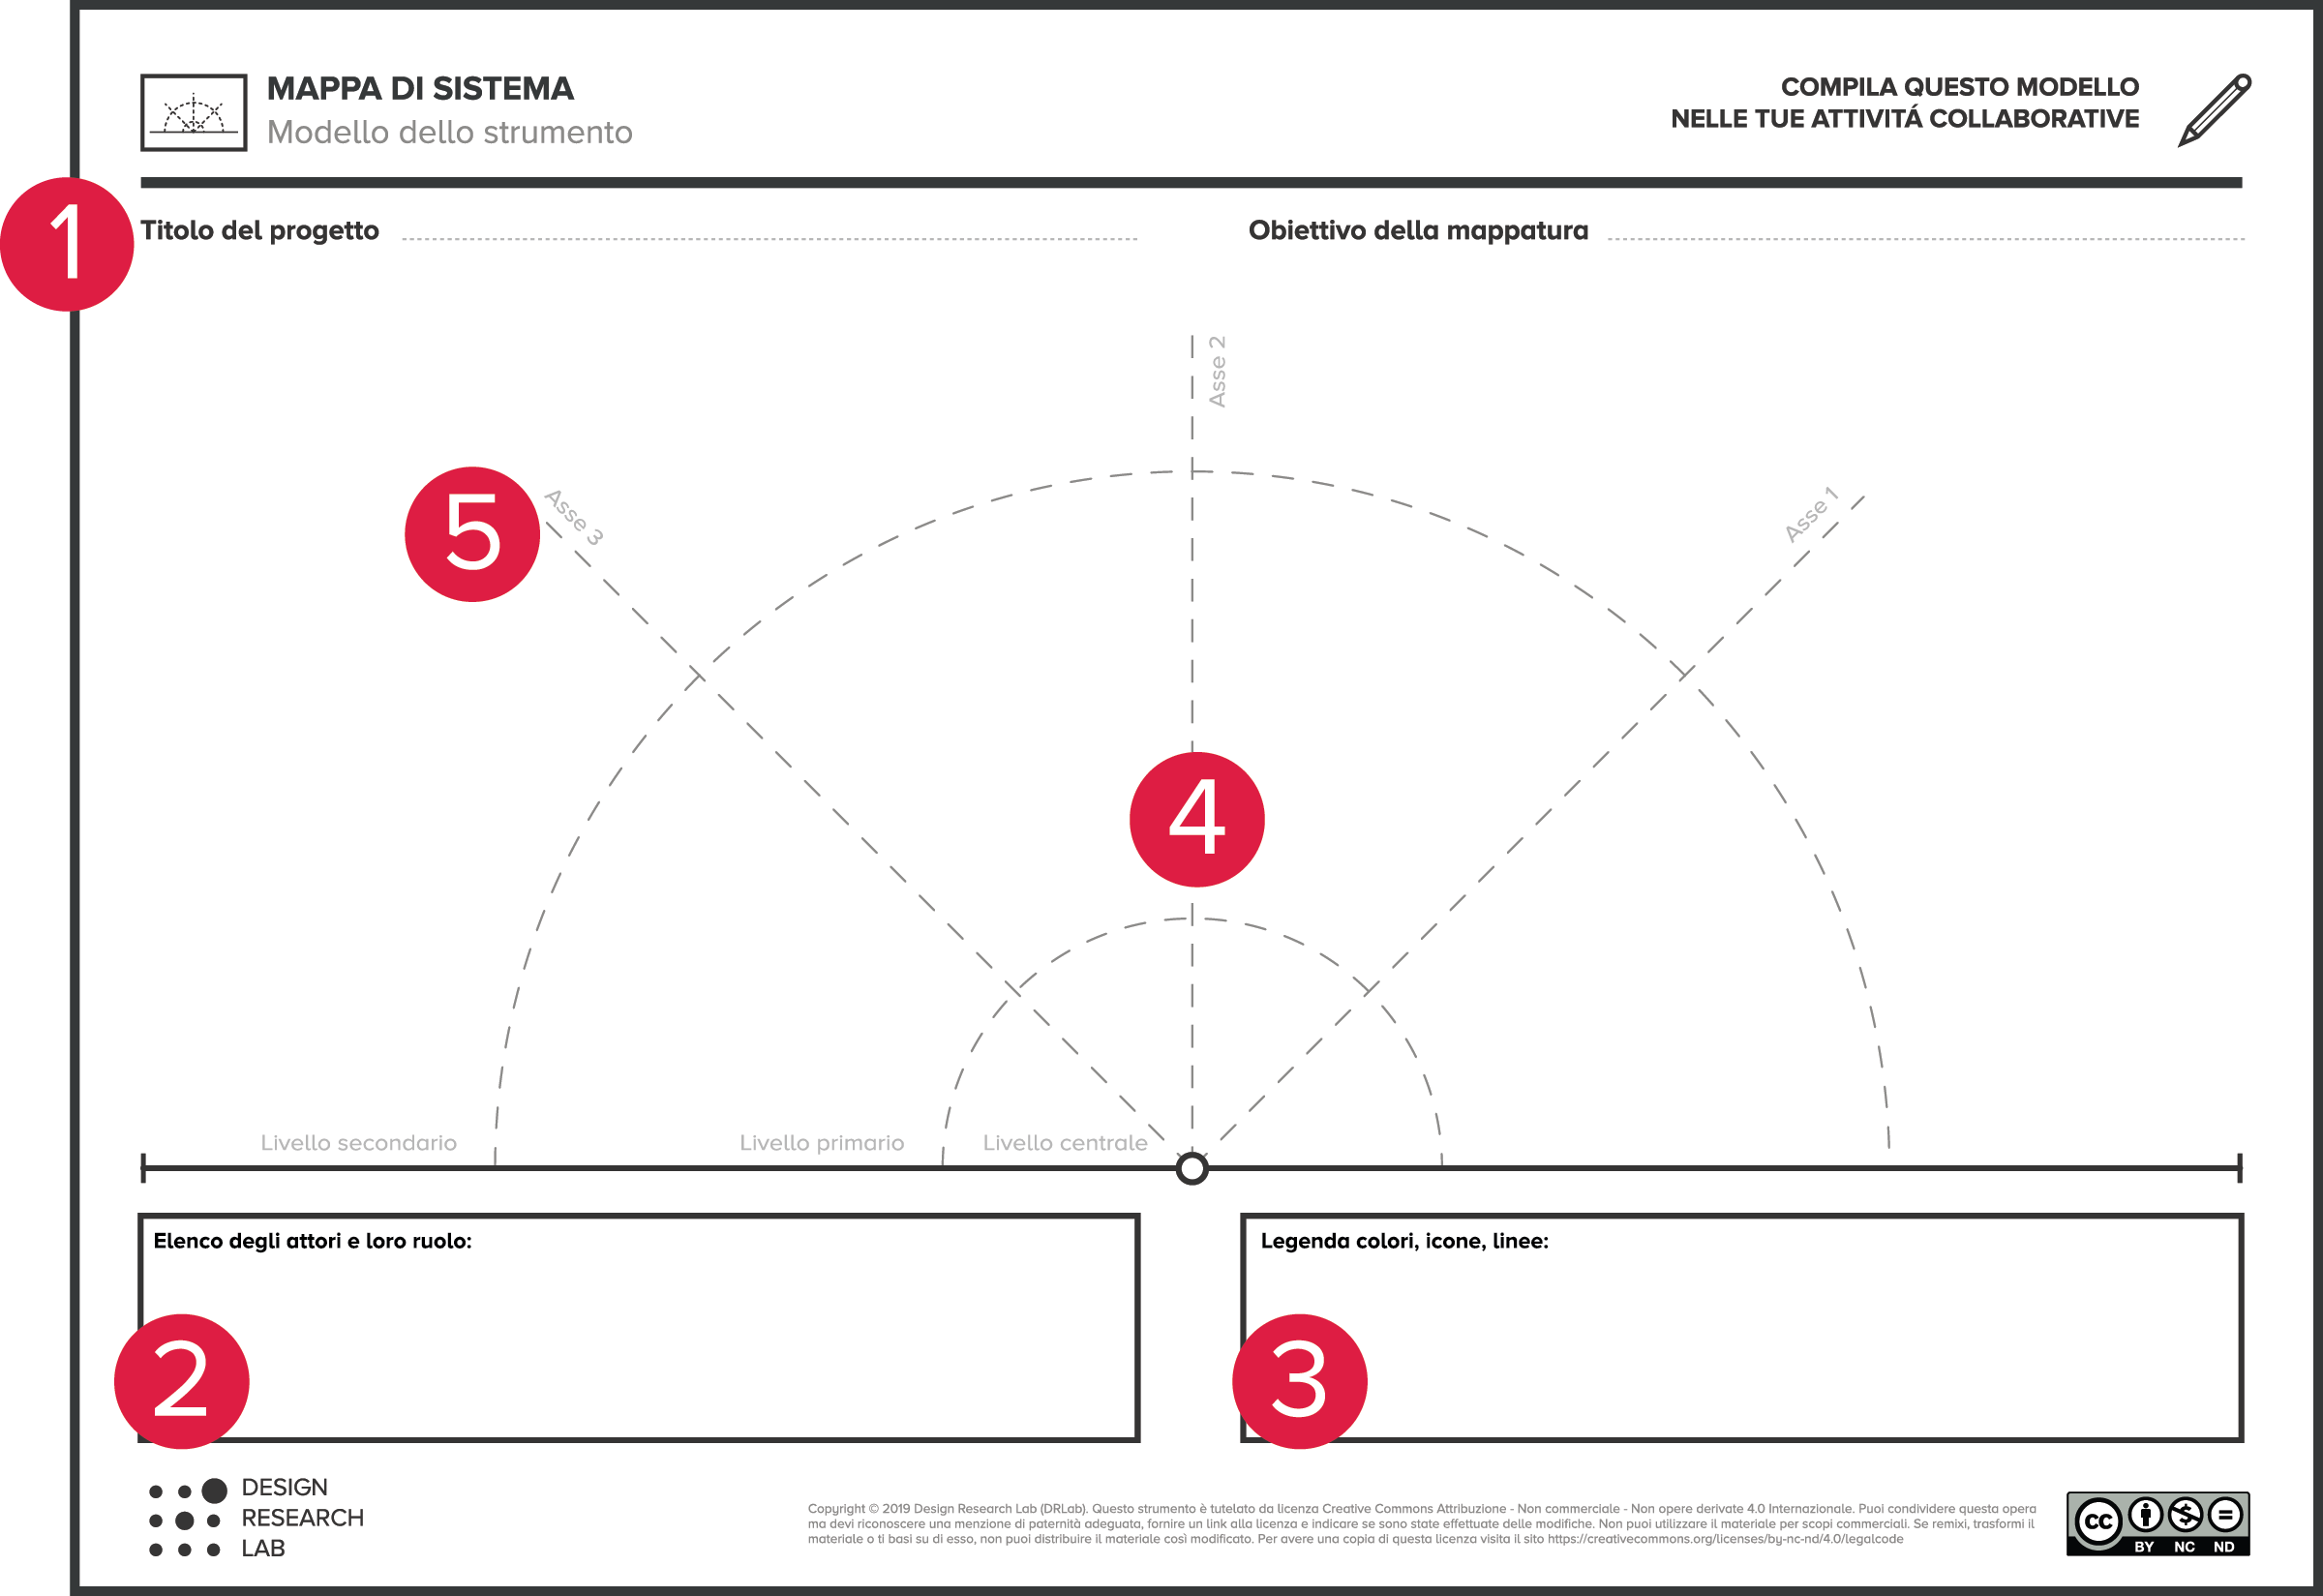
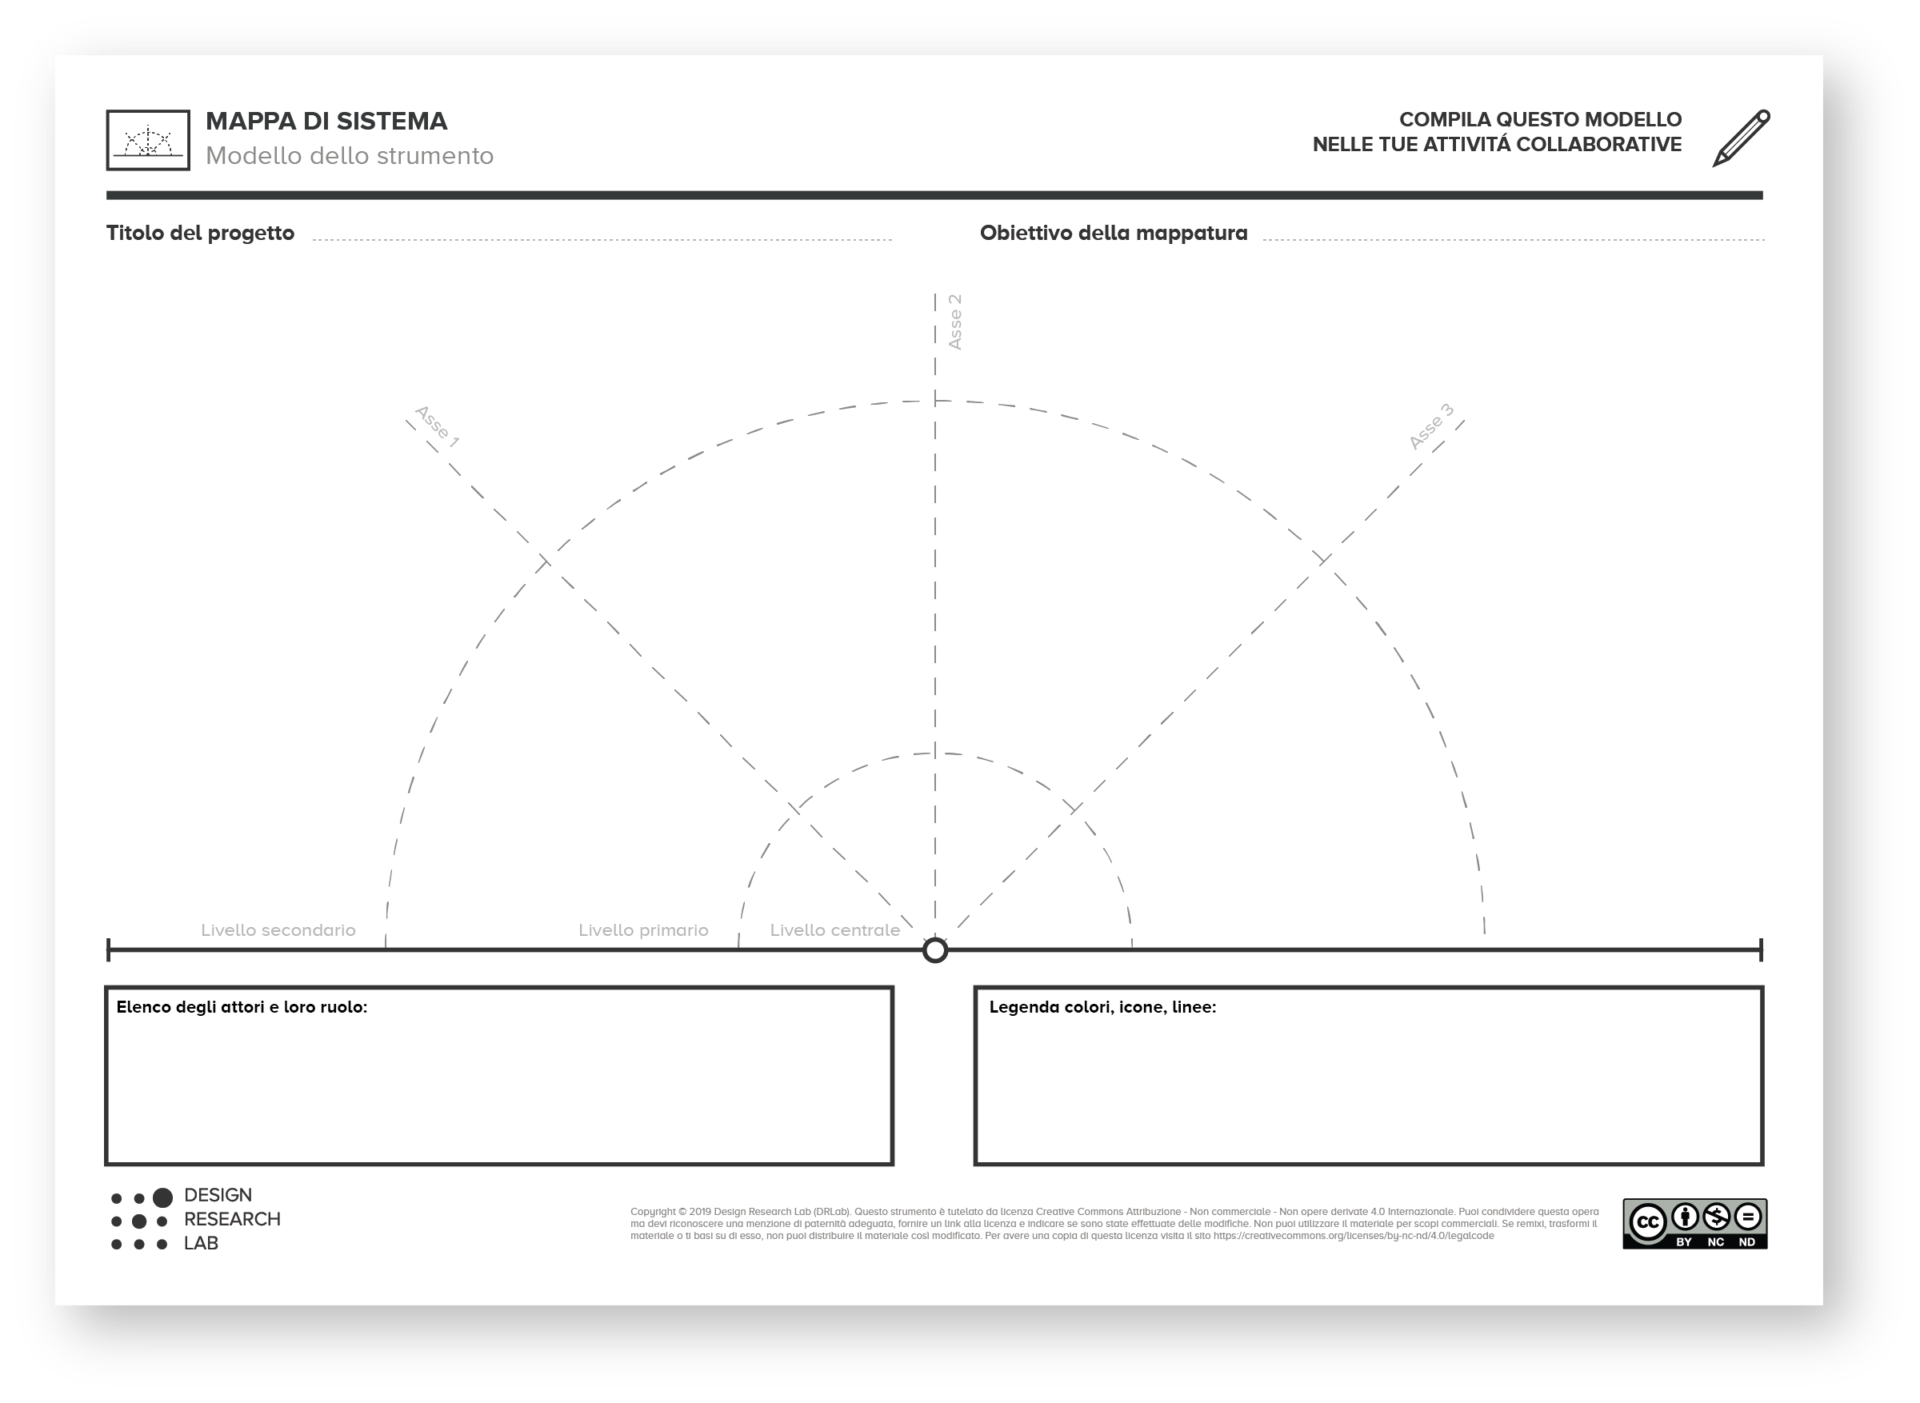
1. Indicate the title of the project. Indicate the objective of the mapping.
2. List the actors that can potentially be part of the system you want to visualize. Make a list of the primary and secondary actors: the users, primary actors providing the service, partners, secondary providers, and all entities and institutions involved in a less direct way. Each of them is represented with an icon indicating its role and the main activity it performs within the system.
3. Define a legend with actor icons, any recognition colors, any icons and/or symbols representing links and relationships.
4. Define the position of actors on the map according to priorities and levels of interest from the center. The farthest from the center still has a role in the system, but occupies a secondary level.
5. Identify the flows and relationships between actors divided into main and secondary. Represent them differently according to type: e.g., economic flows, material flows, information flows. This makes it possible to visualize the relationships and links with respect to the whole system. Indicate the starting point of the sequence of flows; number them and describe them concisely.
N.B. Grouping actors facilitates understanding the organization of actors in their system. Using post-its to manage the position of groups, sub-groups or individual actors facilitates discussion and iterative process in map construction.
Download the manual for using the instrument.
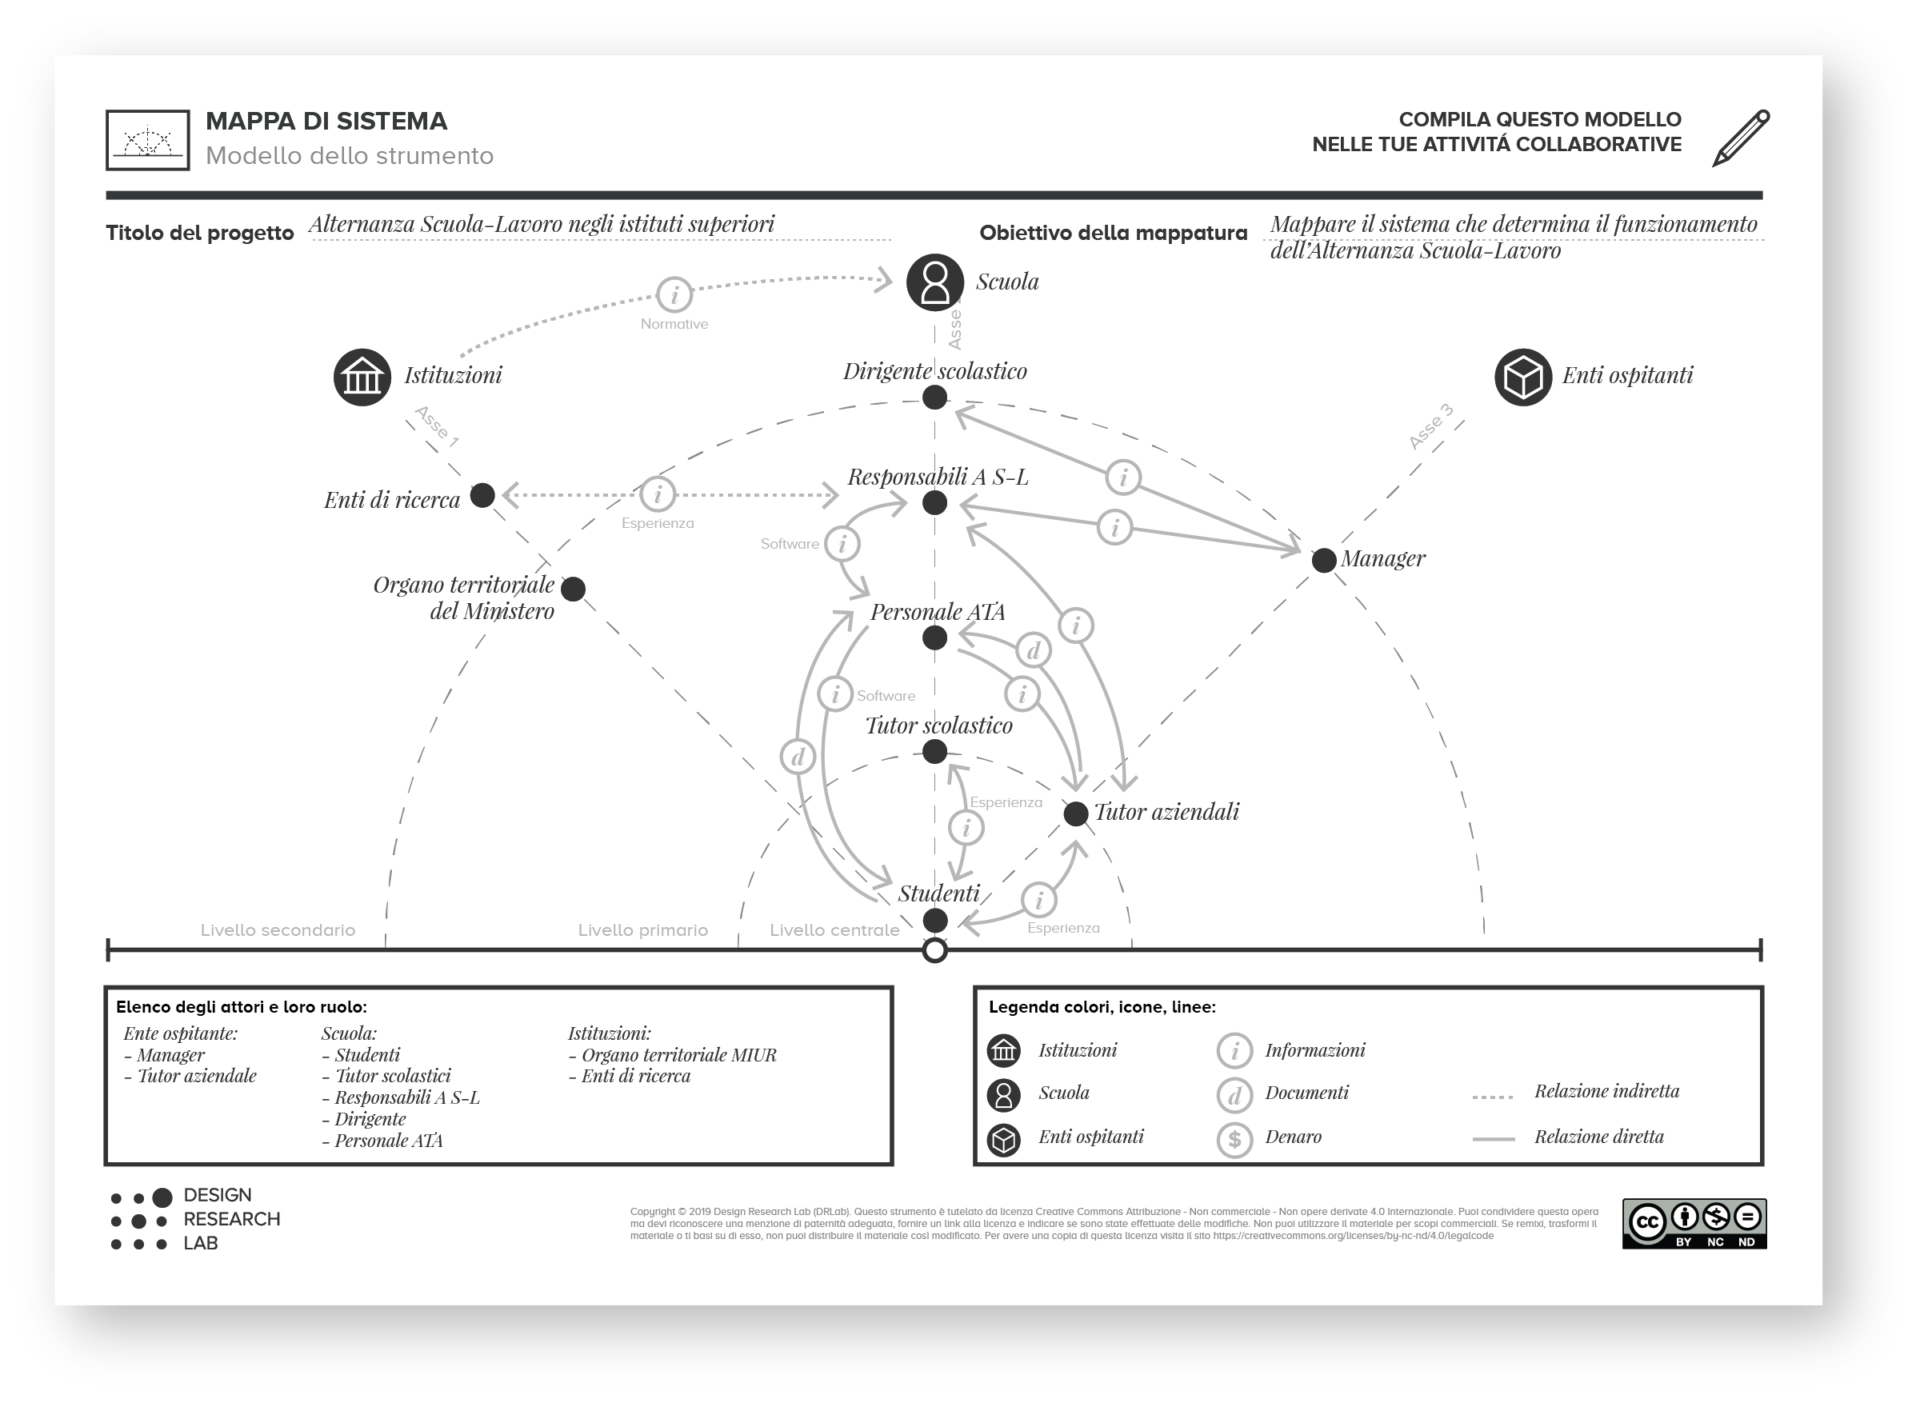
Inside you will find an introduction, instructions for completing it yourself, some of our practical tips, the template (A3 size) and an example on how to fill it out.
You can also download just the A3 or A1 size template here.

Share your experience with us and strengthen your skills.
Please contact us if you would like to share your experience of using the tool, or if you have doubts and want to use it but do not know how.
